
The simple trick to finding the most connected and influential people in a social network
We're all embedded in vast social networks of friends, family, co-workers and more. Nicholas Christakis tracks how a wide variety of traits -- from happiness to obesity -- can spread from person to person, showing how your location in the network might impact your life in ways you don't even know. Christakis highlights how new forms of data collection allow us to locate the central people within a network and ultimately "use these insights to improve society and improve human well-being."

For the last 10 years, I've been spending my time trying to figure out how and why human beings assemble themselves into social networks. And the kind of social network I'm talking about is not the recent online variety, but rather, the kind of social networks that human beings have been assembling for hundreds of thousands of years, ever since we emerged from the African savannah. So, I form friendships and co-worker and sibling and relative relationships with other people who in turn have similar relationships with other people. And this spreads on out endlessly into a distance. And you get a network that looks like this. Every dot is a person. Every line between them is a relationship between two people -- different kinds of relationships. And you can get this vast fabric of humanity, in which we're all embedded.
My colleague, James Fowler and I have been studying for quite sometime what are the mathematical, social, biological and psychological rules that govern how these networks are assembled and what are the similar rules that govern how they operate, how they affect our lives. But recently, we've been wondering whether it might be possible to take advantage of this insight, to actually find ways to improve the world, to do something better, to actually fix things, not just understand things.
So one of the first things we thought we would tackle would be how we go about predicting epidemics.
And the current state of the art in predicting an epidemic -- if you're the CDC or some other national body -- is to sit in the middle and collect data from physicians and laboratories in the field that report the prevalence or the incidence of certain conditions. These data are fed into a central repository, with some delay. And if everything goes smoothly, one to two weeks from now you'll know where the epidemic was today. And actually, about a year or so ago, there was this promulgation of the idea of Google Flu Trends, with respect to the flu, where by looking at people's searching behavior today, we could know what the status of the epidemic was today, what's the prevalence of the epidemic today.
But what I'd like to show you is a means by which we might get not just rapid warning about an epidemic, but also actually early detection of an epidemic. And, in fact, this idea can be used not just to predict epidemics of germs, but also to predict epidemics of all sorts of kinds. For example, anything that spreads by a form of social contagion could be understood in this way, from abstract ideas on the left like patriotism, or altruism, or religion to practices like dieting behavior, or book purchasing, or drinking, or products that people might buy, purchases of electronic goods, anything in which there's kind of an interpersonal spread.
A kind of a diffusion of innovation could be understood and predicted by the following mechanism.

As you probably know, the classic way of thinking about this is the diffusion-of-innovation, or the adoption curve. So here on the Y-axis, we have the percent of the people affected, and on the X-axis, we have time. And at the very beginning, not too many people are affected, and you get this classic sigmoidal, or S-shaped, curve. And the reason for this shape is that at the very beginning, let's say one or two people are infected, or affected by the thing and then they affect, or infect, two people, who in turn affect four, eight, 16 and so forth, and you get the epidemic growth phase of the curve. And eventually, you saturate the population. There are fewer and fewer people who are still available that you might infect, and then you get the plateau of the curve, and you get this classic sigmoidal curve. And this holds for germs, ideas, product adoption, behaviors, and the like.
But things don't just diffuse in human populations at random. They actually diffuse through networks. Because we live our lives in networks, and these networks have a particular kind of a structure.

Now if you look at a network like this - this is 105 people. The dots are the people, and the lines represent friendship relationships. You might see that people occupy different locations within the network. And there are different kinds of relationships between the people. You could have friendship relationships, sibling relationships, spousal relationships, co-worker relationships, neighbor relationships and the like. And different sorts of things spread across different sorts of ties. For instance, sexually transmitted diseases will spread across sexual ties. Or, for instance, people's smoking behavior might be influenced by their friends. Or their altruistic or their charitable giving behavior might be influenced by their coworkers, or by their neighbors.
But not all positions in the network are the same.
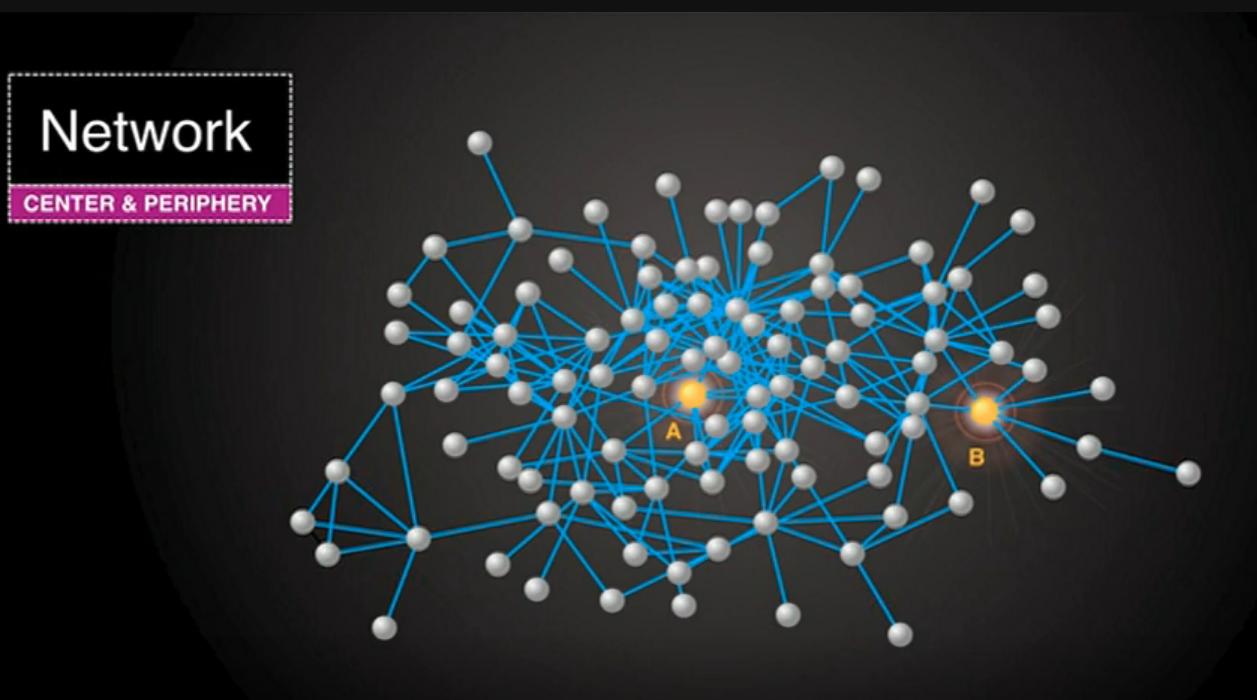
If you look at this, you might immediately grasp that different people have different numbers of connections. Some people have one connection, some have two, some have six, some have 10 connections. This is called the "degree" of a node, or the number of connections that a node has.
But in addition, there's something else.
If you look at nodes A and B, they both have six connections. But if you can see this image [of the network] from a bird's eye view, you can appreciate that there's something very different about nodes A and B.
So, let me ask you this -- who would you rather be if a deadly germ was spreading through the network, A or B? B, it's obvious. B is located on the edge of the network. Now, who would you rather be if a juicy piece of gossip were spreading through the network? A. A is going to be more likely to get the thing that's spreading and to get it sooner by virtue of their structural location within the network. A, in fact, is more central, and this can be formalised mathematically.
So, if we want to track something that was spreading through a network, what we ideally would like to do is to set up sensors on the central individuals within the network, including node A, monitor those people that are right there in the middle of the network, and somehow get an early detection of whatever it is that is spreading through the network.
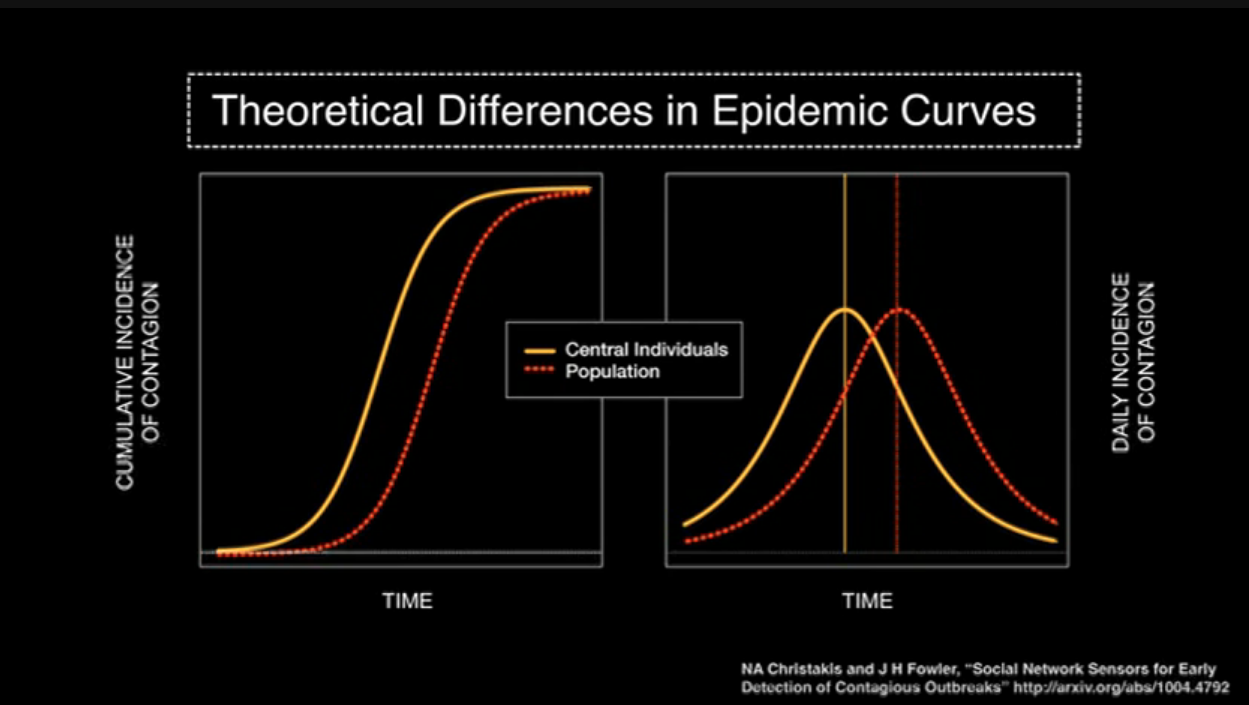
If you saw them contract a germ or a piece of information, you would know that, soon enough, everybody was about to contract this germ or this piece of information. If you could do that, what you would see is something like this. On the left-hand panel, again, we have the S-shaped curve of adoption. In the dotted red line, we show what the adoption would be in the random people, and in the left-hand line, shifted to the left, we show what the adoption would be in the central individuals within the network. On the Y-axis is the cumulative instances of contagion, and on the X-axis is the time. And on the right-hand side, we show the same data, but here with daily incidence. But shifted to the left is what's occurring in the central individuals. And this difference in time between the two is the early detection, the early warning we can get, about an impending epidemic in the human population.
The problem, however, is that mapping human social networks is not always possible. It can be expensive, not feasible, unethical, or, frankly, just not possible to do such a thing.
So, how can we figure out who the central people are in a network without actually mapping the network?
What we came up with was an idea to exploit an old fact about social networks, which goes like this: Do you know that your friends have more friends than you do? This is known as the friendship paradox. Imagine a very popular person in the social network -- like a party host who has hundreds of friends -- and a misanthrope who has just one friend, and you pick someone at random from the population; they were much more likely to know the party host. And if they nominate the party host as their friend, that party host has a hundred friends, therefore, has more friends than they do. And this, in essence, is what's known as the friendship paradox. The friends of randomly chosen people have higher degree, and are more central than the random people themselves.
And you can get an intuitive appreciation for this if you imagine just the people at the perimeter of the network. If you pick this person, the only friend they have to nominate is this person who, by construction, must have at least two and typically more friends. And that happens at every peripheral node. In fact, it happens throughout the network you move in -- when a random person nominates a friend of theirs, you move closer to the center of the network. So, we thought we would exploit this idea in order to study whether we could predict phenomena within networks. Because now, with this idea we can take a random sample of people, have them nominate their friends, those friends would be more central, and we could do this without having to map the network.
And we tested this idea with an outbreak of H1N1 flu at Harvard College in the fall and winter of 2009:
We took 1,300 randomly selected undergraduates, we had them nominate their friends, and we followed both the random students and their friends daily in time to see whether or not they had the flu epidemic. And we did this passively by looking at whether or not they'd gone to university health services. We also had them [actively] email us a couple of times a week.
Exactly what we predicted happened.
The random group is in the red line. The epidemic in the friends group has shifted to the left, over here. And the difference in the two is 16 days. By monitoring the friends group, we could get 16 days advance warning of an impending epidemic in this human population.

I should say that how far advanced a notice one might get about something depends on a host of factors. It could depend on the nature of the pathogen -- different pathogens, using this technique, you'd get different warning -- or other phenomena that are spreading, or frankly, on the structure of the human network. In our case, although it wasn't necessary, we could also actually map the network of the students.
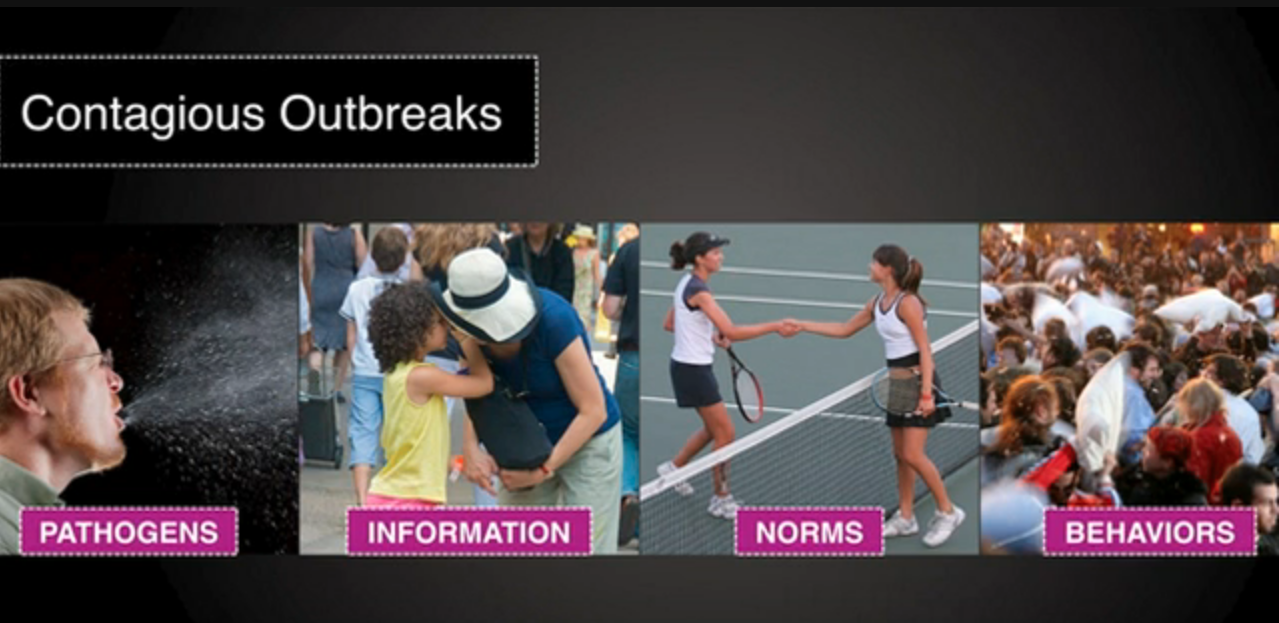
As I've been suggesting, this method is not restricted to germs, but actually to anything that spreads in populations. Information spreads in populations, norms can spread in populations, behaviors can spread in populations. And by behaviors, I can mean things like criminal behavior, or voting behavior, or health care behavior, like smoking, or vaccination, or product adoption, or other kinds of behaviors that relate to interpersonal influence. If I'm likely to do something that affects others around me, this technique can get early warning or early detection about the adoption within the population. The key thing is that for it to work, there has to be interpersonal influence. It cannot be because of some broadcast mechanism affecting everyone uniformly.
Similar ideas can be used, for instance, to target distribution of things like bed nets in the developing world. If we could understand the structure of networks in villages, we could target to whom to give the interventions to foster these kinds of spreads. Or, frankly, for advertising with all kinds of products. If we could understand how to target, it could affect the efficiency of what we're trying to achieve. And in fact, we can use data from all kinds of sources nowadays [to do this].

This is a map of eight million phone users in a European country. Every dot is a person, and every line represents a volume of calls between the people. And we can use such data, that's being passively obtained, to map these whole countries and understand who is located where within the network. Without actually having to query them at all, we can get this kind of a structural insight. Other sources of information are available about such features, from email interactions, online interactions, online social networks and so forth. In fact, we are in the era of what I would call "massive-passive" data collection efforts. They're all kinds of ways we can use massively collected data to create sensor networks to follow the population, understand what's happening in the population, and intervene in the population for the better. Because these new technologies tell us not just who is talking to whom, but where everyone is, and what they're thinking based on what they're uploading on the Internet, and what they're buying based on their purchases. All this administrative data can be pulled together and processed to understand human behavior in a way we never could before.
There are three ways that these massive-passive data can be used.
Fully passive, where we don't actually intervene in the population in any way.
Quasi-active, like the flu example, where we get some people to nominate their friends and then passively monitor their friends -- do they have the flu, or not? -- and then get warning.
Fully active where people might globally participate in wikis, or photographing, or monitoring elections, and upload information in a way that allows us to pool information in order to understand social processes and social phenomena.
In fact, the availability of these data, heralds a kind of new era of what I and others would like to call "computational social science." Now we have access to these kinds of data that allow us to understand social processes and social phenomena in an entirely new way that was never before possible. With this science, we can understand how exactly the whole comes to be greater than the sum of its parts. And actually, we can use these insights to improve society and improve human well-being.
Nicholas A. Christakis, MD, PhD, MPH, is an internist and social scientist who conducts research on social factors that affect health, health care, and longevity. He is Professor of Medical Sociology in the Department of Health Care Policy at Harvard Medical School; Professor of Medicine in the Department of Medicine at Harvard Medical School; Professor of Sociology in the Department of Sociology in the Harvard Faculty of Arts and Sciences; and an Attending Physician (with an emphasis on palliative medicine) in the Department of Medicine at the Mt. Auburn Hospital in Cambridge, Massachusetts.
This is an extract from a 2010 talk delivered by Nicholas Christakis entitled "How social networks predict epidemics" delivered at TED@Cannes, published under a Creative Commons Attribution License
Related Skill
Book a class related to this article: