
Cultural Cartography: How Buzzfeed organises their content
By Dao Nguyen

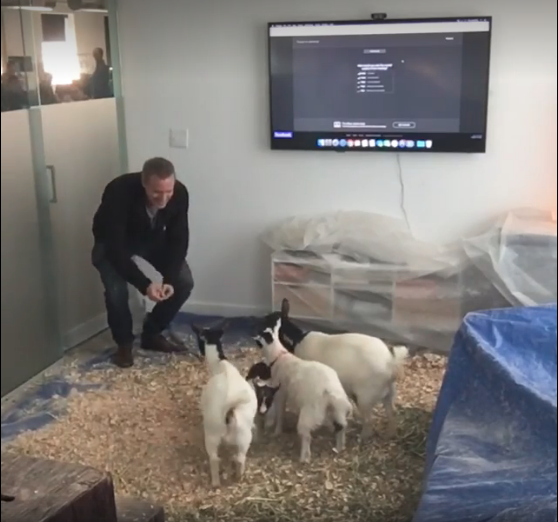
Last year, some BuzzFeed employees were scheming to prank their boss, Ze Frank, on his birthday. They decided to put a family of baby goats in his office.
BuzzFeed had recently signed on to the Facebook Live experiment, and so naturally, we decided to livestream the whole event on the internet to capture the moment when Ze would walk in and discover livestock in his office. We thought the whole thing would last maybe 10 minutes, and a few hundred company employees would log in for the inside joke. But what happened? They kept on getting delayed: he went to get a drink, he was called to a meeting, the meeting ran long, he went to the bathroom. More and more people started logging in to watch the goats. By the time Ze walked in more than 30 minutes later, 90,000 viewers were watching the livestream.
Now, our team had a lot of discussion about this video and why it was so successful. It wasn't the biggest live video that we had done to date (the biggest one that we had done involved a fountain of cheese). But it performed so much better than we had expected. What was it about the goats in the office that we didn't anticipate?
Now, a reasonable person could have any number of hypotheses. Maybe people love baby animals. Maybe people love office pranks. Maybe people love stories about their bosses or birthday surprises. But our team wasn't really thinking about what the video was about. We were thinking about what the people watching the video were thinking and feeling. We read some of the 82,000 comments that were made during the video, and we hypothesized that they were excited because they were participating in the shared anticipation of something that was about to happen. They were part of a community, just for an instant, and it made them happy.
So we decided that we needed to test this hypothesis. What could we do to test this very same thing? The following week, armed with the additional knowledge that food videos are very popular, we dressed two people in hazmat suits and wrapped rubber bands around a watermelon until it exploded.

Eight hundred thousand people watched the 690th rubber band explode the watermelon, marking it as the biggest Facebook Live event to date.
The question I get most frequently is: How do you make something go viral? The question itself is misplaced; it's not about the something. It's about what the people doing the something - reading or watching - what are they thinking?
Now, most media companies, when they think about metadata, they think about subjects or formats. It's about goats, it's about office pranks, it's about food, it's a list or a video or a quiz, it's 2,000 words long, it's 15 minutes long, it has 23 embedded tweets or 15 images. Now, that kind of metadata is mildly interesting, but it doesn't actually get at what really matters. What if, instead of tagging what articles or videos are about, what if we asked: How is it helping our users do a real job in their lives?
The Cultural Cartography of Social Content
Last year, we started a project to formally categorize our content in this way. We called it, "cultural cartography." It formalized an informal practice that we've had for a really long time: don't just think about the subject matter; think also about, and in fact, primarily about, the job that your content is doing for the reader or the viewer.
Let me show you the map that we have today. Each bubble is a specific job, and each group of bubbles in a specific color are related jobs.

First up: humour. "Makes me laugh." There are so many ways to make somebody laugh. You can be laughing at someone, you could laugh at specific internet humour, you could be laughing at some good, clean, inoffensive dad jokes.
"This is me." Identity. People are increasingly using media to explain, "This is who I am. This is my upbringing, this is my culture, this is my fandom, this is my guilty pleasure, and this is how I laugh about myself."
The "Helps me Connect with Another Person" category
"Helps me connect with another person." This is one of the greatest gifts of the internet. It's amazing when you find a piece of media that precisely describes your bond with someone. The green bubbles make up the group of jobs that help me do something -- 'helps me settle an argument'; 'helps me learn something about myself or another person'; or 'helps me explain my story'.
The orange bubbles are the group of jobs that makes me feel something -- makes me curious or sad or restores my faith in humanity.
“If we can capture in data what really matters to you, and if we can understand the role that our work plays in your actual life, the better content we can create for you, and the better that we can reach you”
Many media companies and creators do put themselves in their audiences' shoes. But in the age of social media, we can go much farther. People are connected to each other on Facebook, on Twitter, and they're increasingly using media to have a conversation and to talk to each other. If we can be a part of establishing a deeper connection between two people, then we will have done a real job for these people.
Let me give you an example of how this plays out. This is one of my favorite lists: "32 Memes You Should Send Your Sister Immediately". It has things that are relatable, like: "When you're going through your sister's stuff, and you hear her coming up the stairs." Absolutely, I've done that. "Watching your sister get in trouble for something that you did and blamed on her." Yes, I've done that as well. This list got three million views. Why is that? Because it did, very well, several jobs: "This is us." "Connect with family." "Makes me laugh."

Now, we can even apply this framework to recipes and food. A recipe's normal job is to tell you what to make for dinner or for lunch. And this is how you would normally brainstorm for a recipe: you figure out what ingredients you want to use, what recipe that makes, and then maybe you slap a job on at the end to sell it. But what if we flipped it around and thought about the job first? One brainstorming session involved the job of bonding. So, could we make a recipe that brought people together? This is not a normal brainstorming process at a food publisher. So we know that people like to bake together, and we know that people like to do challenges together, so we decided to come up with a recipe that involved those two things, and we challenged ourselves: Could we get people to say, "Hey, BFF, let's see if we can do this together"? The resulting video was the "Fudgiest Brownies Ever" video. It was enormously successful in every metric possible -- 50 million views. And people said the exact things that we were going after: "Hey, Colette, we need to make these, are you up for a challenge?" "Game on." It did the job that it set out to do, which was to bring people together over baking and chocolate.
Metadata and Storymaking
I'm really excited about the potential for this project. When we talk about this framework with our content creators, they instantly get it, no matter what beat they cover, what country they’re in, or what language they speak. So cultural cartography has helped us massively scale our workforce training. When we talk about this project and this framework with advertisers and brands, they also instantly get it, because advertisers, more often than media companies, understand how important it is to understand the job that their products are doing for customers.
But the reason I'm the most excited about this project is because it changes the relationship between media and data. Most media companies think of media as "mine." How many fans do I have? How many followers have I gained? How many views have I gotten? How many unique IDs do I have in my data warehouse? But that misses the true value of data, which is that it's yours. If we can capture in data what really matters to you, and if we can understand more the role that our work plays in your actual life, the better content we can create for you, and the better that we can reach you.
Who are you? How did you get there? Where are you going? What do you care about? What can you teach us? That's cultural cartography.

As a Media Analytics Expert and Publisher of BuzzFeed, Dao Nguyen thinks about how media spreads online and the technology and data that publishers can use to understand why. Dao Nguyen is the Publisher of BuzzFeed, a reinvention of the traditional title in which she oversees the company’s tech, product, data and publishing platform, as well as ad product, pricing, and distribution. Nguyen joined BuzzFeed in 2012 and has been instrumental in its rapid growth as the largest independent digital media company in the world
This is an extract from a 2017 talk delivered by Dao Nguyen entitled "What Makes Something Go Viral?" delivered at TedNYC, published under a Creative Commons Attribution License